Demystifying the Charts: An Introduction to Technical Analysis in Forex
The foreign exchange market, or forex for short, pulsates with constant price movements. For traders seeking to navigate this dynamic landscape and make informed decisions, technical analysis emerges as a powerful tool. Unlike fundamental analysis that focuses on economic factors, technical analysis scrutinizes historical price data and chart patterns to identify potential trading opportunities. By delving into the world of technical analysis, forex traders can gain valuable insights into market sentiment and predict future price movements with a higher degree of accuracy.
The Core Tenets of Technical Analysis
Technical analysis rests on several fundamental assumptions:
- Market Prices Reflect All Available Information: Technical analysts believe that all relevant information, including fundamental factors, economic data, and investor sentiment, are already reflected in the current market price. By studying price movements and chart patterns, they aim to extract valuable information about future price direction.
- History Repeats Itself: Technical analysts recognize that certain price patterns tend to reoccur over time. By identifying these patterns and understanding their historical implications, they can make educated guesses about potential future price movements.
- Technical Indicators Offer Guidance: Technical analysts employ a variety of technical indicators derived from price and volume data. These indicators, such as moving averages, relative strength index (RSI), and Bollinger Bands, can help identify trends, gauge market momentum, and assess potential support and resistance levels.
Charting the Course: Essential Chart Types in Forex
Technical analysis heavily relies on visual representations of price movements over time, known as charts. Here are two fundamental chart types commonly used in forex trading:
- Line Charts: These charts depict the closing price of a currency pair over a specific period. Line charts offer a simplified view of price trends, allowing for easy identification of overall price movements.
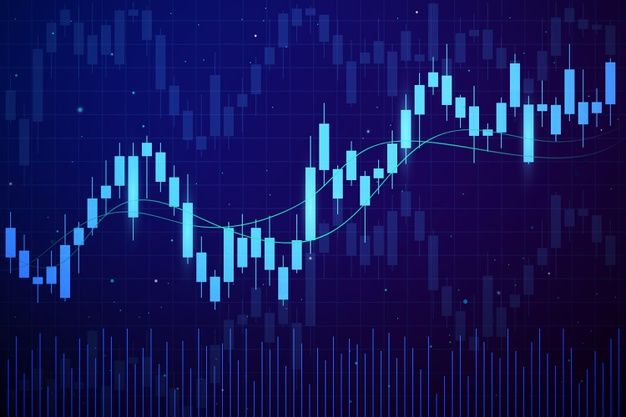
- Candlestick Charts: These more detailed charts depict the opening, high, low, and closing prices of a currency pair within a specific timeframe. Each candlestick (or bar) provides valuable information about market sentiment during that period.
A Language of Its Own: Recognizing Common Chart Patterns
Technical analysts identify recurring chart patterns that can signal potential future price movements. Here are some widely recognized patterns:
- Trend Lines: These are diagonal lines drawn along the highs or lows of a chart, indicating the overall direction of the market (uptrend, downtrend, or sideways trend).
- Support and Resistance Levels: Support levels represent price zones where buying interest is likely to be strong, potentially halting or reversing a downtrend. Conversely, resistance levels represent price zones where selling pressure is likely to be high, potentially halting or reversing an uptrend.
- Head and Shoulders: This reversal pattern suggests a potential trend change from uptrend to downtrend. It resembles a head with two lower shoulders on either side.
- Double Tops/Bottoms: These patterns indicate potential trend reversals, with two consecutive highs (double top) or lows (double bottom) suggesting a change in momentum.
Beyond the Basics: Combining Technical Analysis with Other Strategies
While technical analysis offers valuable insights, it shouldn’t be used in isolation. A well-rounded forex trading strategy often combines technical analysis with fundamental analysis, considering economic data, interest rates, and geopolitical events. Additionally, risk management practices like stop-loss orders and position sizing are crucial for mitigating potential losses.
The Art and Science of Technical Analysis
Technical analysis is not a crystal ball that guarantees future profits. Market movements are inherently complex and influenced by various factors. However, by understanding the core principles, familiarizing yourself with chart types and patterns, and employing technical analysis alongside other strategies, you can gain a significant edge in the forex market. Remember, technical analysis is an ongoing learning process that requires discipline, practice, and continuous refinement of your skills. As you embark on your forex trading journey, technical analysis will serve as a valuable tool for navigating the ever-changing dynamics of the market.

Leave your comment